A global league table for pig production
Brexit or no Brexit? An imminent break by the UK from the rest of the European Union may soon happen – but even now as this is being published is isn’t clear whether or not the UK will leave the EU on October 31st. It is a good moment to zoom in on Britain’s pig industry and ask ourselves – how does it perform in comparison to other countries?
Each year the British Agriculture and Horticulture Development Board (AHDB) Pork publishes the InterPIG report which summaries and tabulates the key pig production and financial data from a range of countries around the world. The 2018 InterPIG report* was released at the end of 2018 and this contains a valuable set of data on the relative costs of pig production and comparisons of technical performance in the InterPIG group of 18 countries.
Data from 18 countries
The report uses data from 2017 for 18 countries and regions (17 countries, 2 regions in Brazil, and 2 systems in Great Britain- free-range and indoor) and covers the costs of production and various technical key performance indicators (KPIs). The figures show data for 11 countries, using the Mato Grosso region for Brazil and an average for the 2 GB systems for pigs weaned.
Podcast: Brexit and its effect on pig farmers
By comparing several tables and figures, the financial and physical data can be used to construct a global ranking of pig production efficiency. This is a key feature of the report – and it contains some very useful data albeit the financial analysis is (as all international comparisons are) open to challenge because of the influence of volatile exchange rates (especially true for the pound sterling).
The report does not consider the impact of exchange rates in any detail. The report’s biggest contribution is probably in the assembly of KPIs for pig production in a harmonised format. These, effectively, establish a ‘global league table’ of technical efficiency or, put another way, they compare the technical productivity of the pig producer’s breeding sow in different countries – the farmer’s key investment asset.
When key costs of production like feed (albeit being wary of falling into the exchange rate trap) are also considered, these data provide a useful analysis of who is winning and who is losing the global race for the most competitive pig production sector. This league table is especially relevant to British pig producers and their value chain in a post-Brexit world where global trade and productivity growth are claimed to be crucial for GB agriculture in the future.
“The number of pigs weaned per sow per year in Great Britain increased by 4%..” – InterPIG report notes
Efficiency comparing absolute levels
The figures and tables presented alongside illustrate that the Danes, Germans, French and Dutch are much more efficient than British producers when comparing the absolute levels of 2 key KPIs:
- pigs weaned and
- pigs finished per sow per year
The report’s authors helpfully present these key drivers for pigs over a long period and this enables the calculation of annual growth rates.
When comparing these rates of change, however, it seems that the British pig industry’s pigs weaned per sow metric is improving at a slightly higher rate per annum than its immediate neighbours; Germany, Denmark, Netherlands and France: GB has managed to improve this metric by about 2.6% per annum in the 5 years 2012-17. Its EU competitors are only managing, on average, a little less than 2% growth per annum. The average number of pigs weaned per sow per year in the northern European InterPIG countries (Denmark, Netherlands, Germany and France) has increased by 1.6% over the period 2012-17. Excluding France the average jumps to 1.7% for Britain’s competitors.
Comparing pigs finished per sow shows British producers in a slightly worse light. The Brits have an annual growth rate of 2.2% in this metric and Denmark, Netherlands, Germany and France show an average value of only 1.8%. However, without France those big 3 continental producers have an annual growth rate of 2% in pigs weaned per sow. In the case of both metrics British producers are at the bottom end of the global league table in absolute terms.
Higher production costs
This lower efficiency for GB producers might not matter if their costs were not relatively higher. But they are higher. As AHDB notes, “…feed costs averaged 87p (€ 0.98) per kg in Great Britain, compared with the 75p (€ 0.85) recorded in 2016, an increase of 16%. The increase in feed costs in Great Britain during 2017 compared with the average EU increase of 6%. Feed costs in Great Britain were higher than the EU average of 80p (€ 0.91) per kg compared with the zero difference in 2016.”
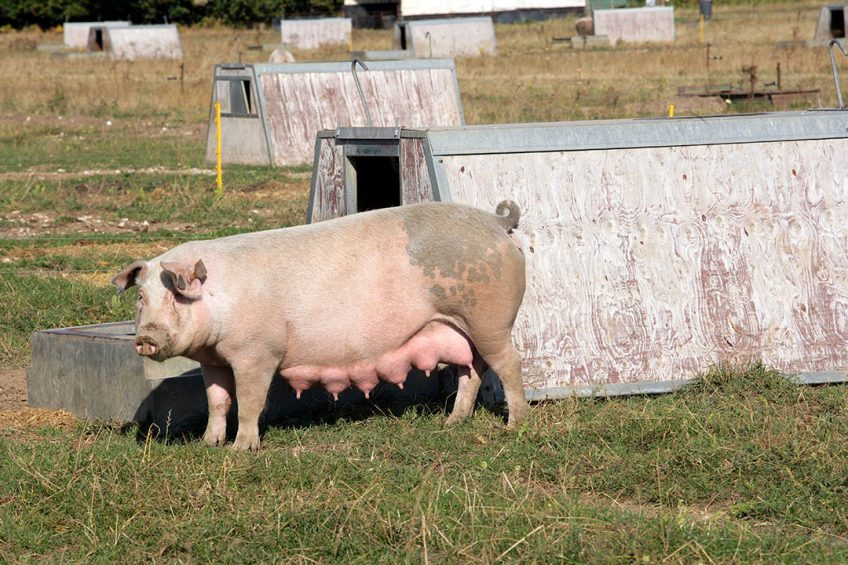
The InterPIG report notes that, “The number of pigs weaned per sow per year in Great Britain increased by 4% to 25.75 (indoor sows 26.97, outdoor sows 23.95). While Great Britain has a significant proportion of sows kept outdoors, the lower number of pigs weaned per sow per year in all systems is still a major cause of the relatively high cost of production compared with many other EU countries and needs to be addressed if Great Britain want to be competitive with the rest of Europe.”
A sense of déjà vu
In summary, there is a sense of déjà vu in this InterPIG report and its data. In previous reports there have been similar results. Each country is improving its KPIs but the relative positions of countries are not changing significantly. If pig producers for each country were represented by being on an escalator (each striving to increase their productivity) then ‘champion’ producers need to be on an escalator that is going up at a faster rate than those of its competitors. For the British pig industry there is some evidence, for some metrics and KPIs, that this is happening but the profitability of pig farming in GB is a drag on this improvement since costs are going up faster than productivity can match. And this will seriously hinder investment.
The last KPI considered in this review, carcass meat production per sow per year, presents good and bad news. The good news is that British producers have recorded a very respectable rate of growth in this KPI (+2.5%) over the 2012-17 period. The 4 northern European producers achieved a 2.2% growth rate in this KPI (+2.5% without France).
The bad news is that Ireland, Denmark and Germany achieved rates of productivity growth in this metric of 3.2% and 3.3% and 2.6% respectively. And even more bad news is the realisation that carcass meat production is the key driver for revenue generated per sow but British farmers produce much, much less meat per breeding animal than their competitors.
* The report does not include data on Northern Ireland, hence it speaks of Great Britain and not of the United Kingdom.
Figure 1 – Pigs finished per sow per year.

Figure 2 – Comparing carcass meat production/sow/year in Europe.

Figure 3 – Pigs weaned per sow/year, 2015-2017.

Figure 4 – Pigs finished per sow per year, 2015-2017.

Figure 5 – Carcass meat production, kg per sow/year, 2015-2017.