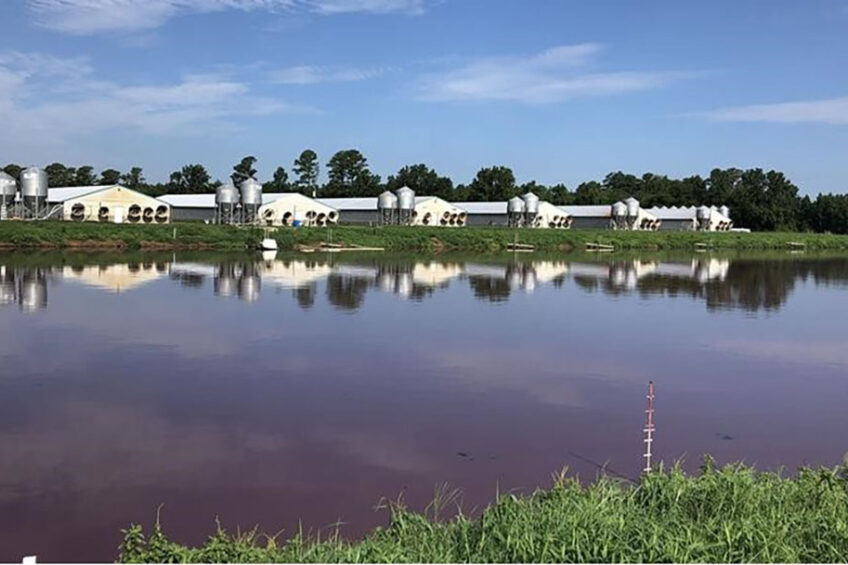
Eye from the sky: US swine manure lagoons
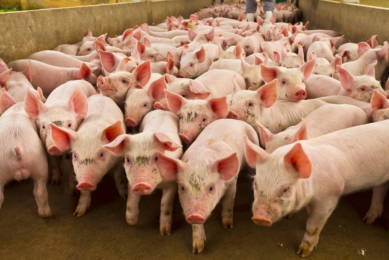
Understanding the impact of swine lagoons on the environment is important, especially in the US, where there are many large swine operations across many states.
A team at North Carolina State University has developed an automated technique that uses satellite imagery to determine when swine waste lagoons were constructed, providing insight into how these facilities may have affected the environment (for example, water quality) over the years.
Not nearly enough data
Before this development, the only data that could assist with this type of analysis was the total number of pigs being farmed in each county, data which was reported historically to the US Department of Agriculture every 5 years. Also, about 20 or 30 years ago, depending on the state, pig farm permit requirements were established, but put together, this data was not nearly enough.
Germination for project
The idea for this research came about when a professor at North Carolina State University (NCSU) asked a colleague, Assistant Professor Natalie Nelson, whether satellite images could detect swine concentrated feeding operations over time. Nelson then asked PhD candidate (and paper co-author) Lise Montefiore, about her interest in the question.
Montefiore “was thrilled” with the idea of using satellite images in her research, and explains that after some research was done, “it was clear that farm locations and their year of construction were critical. We needed information to understand the potential connection between the historical growth of swine concentrated feeding operations and long-term water quality trends. Based on this initial conversation and preliminary research, the idea germinated.”
Because Nelson and Montefiore were new to animal science, they asked Mahmoud Sharara, assistant professor of biological and agricultural engineering at NCSU, for his input and assistance in understanding the state’s agricultural history and interpreting the data.
Conclusions
While no conclusions have thus far been made, progress is occurring in tying the dates of manure lagoon construction to historical environmental monitoring data to achieve a better understanding of how the number of lagoons may have affected the environment in terms of changes in air quality, water quality or other variables.
Water quality data
In terms of water quality data, North Carolina has a long historical record. Montefiore explains that there are several monitoring stations with over 40 years of records with four samples taken per year, allowing estimation of historical water quality trends.
Dramatic changes
Looking broadly at changes to land use over the past 40 years in North Carolina, Sharara uses the term “dramatic” to describe them – and their impact on the environment is quite certain.
“The US population increased by 45% between 1980 and 2020, while the NC population increased by 78% over the same period,” he says. “Similarly, animal agriculture (poultry and swine) increased dramatically over this period. These changes put pressure on natural systems (soils, air, and groundwater and surface water) to recycle water and nutrients safely.”
Oher data uses
Beside discerning environmental impact of swine production in North Carolina, the data can also be employed in modeling analyses to understand, for example, the benefits of best management practices over time.
“Watersheds with extensive animal production over several decades present large legacy nutrient stores that can mask the effects of current management practices and discourage further implementations of water quality management and policies,” says Montefiore. “The new data can be integrated into water quality models to simulate the long-term effects of swine manure application over time and estimate realistic nutrient loading recovery timelines.”
As we understand how quick the change in the landscape impacted water quality, we can predict the timeline for management changes to show up as water quality improvements
PhD candidate and paper co-author Lise Montefiore
Predicting the timeline for management
She notes that such information is critical to understand and assess the long-term responses to management and water quality policies.” As we understand how quick the change in the landscape impacted water quality,” she says, “we can predict the timeline for management changes to show up as water quality improvements.”
Sharara adds that the dataset can also be used “to give us a better idea of dynamics of industry growth and supply-chain development: feed mills, farms and processing facilities. This can help inform planning in states where animal agriculture is growing to ensure efficient and environmentally-sustainable planning and growth.”