Health challenges are top obstacles to Full Value Pigs
Which disease takes the heaviest toll on pigs in Europe? How does ileitis prevalence in Asia compare to Latin America? What’s viewed as the No. 1 way to increase the percentage of ‘Full Value Pigs’ for producers in the US/ Canada? Answers to these and many similar questions confronting pork producers worldwide are to be found in the results from a global survey.
Pig producers view disease and variation as the top obstacles to achieving more Full Value Pigs. A strong majority say they lose $11 or more for every pig that fails to reach full value. Worldwide producers consider Mycoplasma hyopneumonia to be the number 1 health challenge. These and many more conclusions can be drawn from a global survey sponsored by Elanco Animal Health and first presented at the 2012 IPVS Congress. The survey of almost 500 swine industry professionals in 32 countries was designed to assess global disease threats, better understand feed management and compare global practices. The questions focused on Full Value Pigs and its four key components:
• Disease management: Holisticapproach to herd health.
• Feed optimisation: Getting themost out of producers’ biggest input.
• Precision harvest: Delivering theright weight at the right time.
• Assurance and access: Enabling producers to deliver quality pork to
their desired market. Ginger Pelger, a swine technical consultant for Elanco Animal Health, expressed that they hope that producers will use the results of this study to assess disease threats and better understand feed management. The findings can also be helpful as far as comparing global results and practices – individual operations can see how they stack up against their peers on a regional and international basis.
The survey shows that there are different ideas about what the phrase ‘Full Value Pigs’ means and how it’s measured. For example, nearly 95% of respondents say their percentage of Full Value Pigs is average or above average. Yet, nearly half of all respondents also say they have 80% or fewer Full Value Pigs per group. “This shows clearly that there’s some room for improvement,” Pelger says.
Full Value Pigs
Globally, more than half (56%) of all producers say they keep track of their number of Full Value Pigs. Producers in the US/Canada were most likely to keep track (66.5%), while producers in Latin America were least likely (30.4%).
However, when asked to define ‘Full Value Pigs’, answers varied. A plurality chose “pigs receiving no discounts on the marketing grid,” while fewer than one-third chose the correct definition of “pigs achieving ≥ 90% of maximum margin over feed cost” (Figure 1). The findings suggest producers recognise the importance of tracking a profitability metric but disagree over which one.
Nearly 95% of respondents consider their percentage of Full Value Pigs to be average or above average. Globally, a majority of producers say they average more than 80% Full Value Pigs per group. US/ Canada reported the highest percentage of Full Value Pigs, while Europe reported the lowest.
The survey found little consensus about how much money producers lose for each pig that fails to reach full value (Figure 2). The percentage who said ‘$10 or less’ was nearly the same as the percentage who said ‘more than $25’. The most popular response (25.7%) was losses of $16 to $20 per pig. The discrepancies could be the result of an unclear definition of Full Value Pigs or possibly regional differences in payments and costs.
When producers were asked which factors prevent them from achieving more Full Value Pigs, two factors clearly emerged: disease (36.9%) and variation (28.4%). No other factor received more than 12.7% of responses.
A strong majority (61.9%) in Asia/Pacific Rim cited disease as the top factor – a response rate twice that of the US/Canada and Europe. Variation received the highest response rate in the US/Canada (36%), followed by Latin America (21.9%).
Respondents also found some consensus when asked about the best way to increase Full Value Pigs (Figure 3). Almost half (49.4%) cited ‘reducing the effects of disease’ as the best choice. It was cited more than three times as often as any other action.
Regional differences emerged. Asia/Pacific Rim reported the highest percentage (56.5%) for ‘reducing the effects of disease’. Europe cited disease less often than any other region. However, other factors were higher in Europe, including ‘improve facilities handling’ at 32.4%, which is more than twice the rate cited in US/Canada and Asia/Pacific Rim.
Disease management
The three most widely reported health threats were Mycoplasma hyopneumonia, PRRS and Streptococcus suis (Figure 4), followed closely by E. coli and ileitis/ proliferative enteropathy. Rates of Streptococcus suis and E. coli were nearly the same, as were the rates of H. parasuis and swine influenza virus. But the top health challenges varied within each region (Figure 5). Incidence of PRRS, E. coli and Streptococcus suis were highest in Europe. US/Canada reported nearly double the rate of swine influenza than other regions. And Asia/Pacific Rim posted the highest incidence of H. parasuis and ileitis/ proliferative enteropathy.
Swine respiratory disease and ileitis continue to pose challenges across all regions. More than 70% said swine respiratory disease has remained the same or become more serious within the past year. The response for ileitis was nearly the same (69.2%). Reports of ‘more serious’ threats from respiratory disease and ileitis were higher in Latin America and Asia/Pacific Rim. Generally, US/Canada and Europe reported less severe threats, indicating either improved control methods or decreased disease pressure.
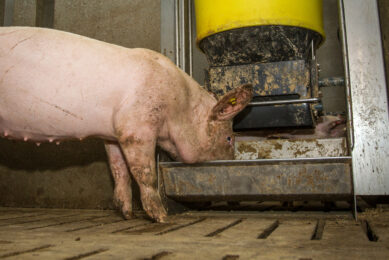
Feed optimisation
For most respondents, feed is the single largest cost associated with raising a pig. Nearly 7 in 10 agreed that feed represents 61% to 80% of the total cost of raising a pig. In Latin America, nearly three-fourths of all respondents said feed accounts for as much as 80% of the total cost. Factors such as feed costs and labour costs can help explain regional differences.
More than half (52%) of all producers expect feed as a percentage of total costs to increase during the next three years (Figure 6). Fewer than one in five expect it to decrease. Expected increases were highest in Asia/ Pacific Rim, where 58.7% expect the cost to increase by 1% to 5% or more. In Europe, only 40% expected the cost to increase, and a plurality (42.2%) expected the cost to stay about the same. The survey respondents also reported a strong link between animal health and feed optimisation. Respon-dents overwhelmingly cited ‘improved animal health’ as the number 1 factor that helps optimise feed (Figure 7). At 47%, it received more than twice the responses as the next closest option, changing nutrition (20.2%).
Precision harvest
More than 80% of all respondents targeted weights between 101 to 140 kg (222 to 308 lbs). And almost six in 10 respondents (58%) say it takes 151 days or longer for pigs to reach their target market weight. Genetics and/ or nutrition could explain differences among regions. In general, the US/ Canada tended to have higher weights and fewer days while Asia/ Pacific Rim tended to have lighter weights and more days (Figures 8 and 9).
Lightweights remain a significant challenge for producers in every region. A total of 64% of all respondents report that 6% to 15% of pigs in their last group are below target weight (Figure 10). More than one-third of producers in every region (except US/Canada) report 11% or more of their pigs were below target weight when the last pigs in the group were sold.
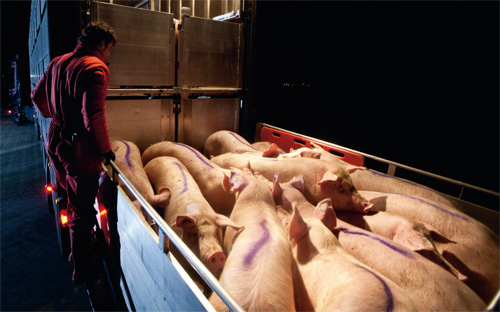
Assurance & access
Almost two-thirds of all respondents (65.4%) report they use generic products. Use of generics was highest in Europe (83.7%) and Asia/Pacific Rim (82.5%), and lowest in Latin America (53.5%). When price is not a consideration, respondents consider ‘quality formulation/ GMP’ more than other factors in deciding between a generic and branded products.
Almost half of all respondents say they export pork (Figure 11). Fewer than 20% of respondents in Latin America and Asia/Pacific Rim said they export pork. US/ Canada producers reported the highest rates, with more than 70% exporting pork.
Join 18,000+ subscribers
Subscribe to our newsletter to stay updated about all the need-to-know content in the pigsector, three times a week.